
Metrics to track the progress of your project and the health of your data. Metrics are split into different sections:
Overview
A simple overview of your project's settings and members.
Inter-Annotator Agreement
You can read all about the Inter-Annotator Agreement (IAA) here.
Documents
The following charts are available:
Project progress. It gives you a general view of the progress in your project by showing the number of documents that are production ready (master version confirmed), the number of documents ready for review (master version not confirmed, but any member's version confirmed) and the number of documents in progress (documents not confirmed in any version).
Annotated / Not Annotated documents. Annotated documents are those with at least one annotation of any kind (document label, entity, etc.) in the master version, or those with one of the member's version confirmed. Not annotated documents are those not meeting this criteria.
Progress by member. Track the number of documents confirmed by each of the members (on their version) of the project.
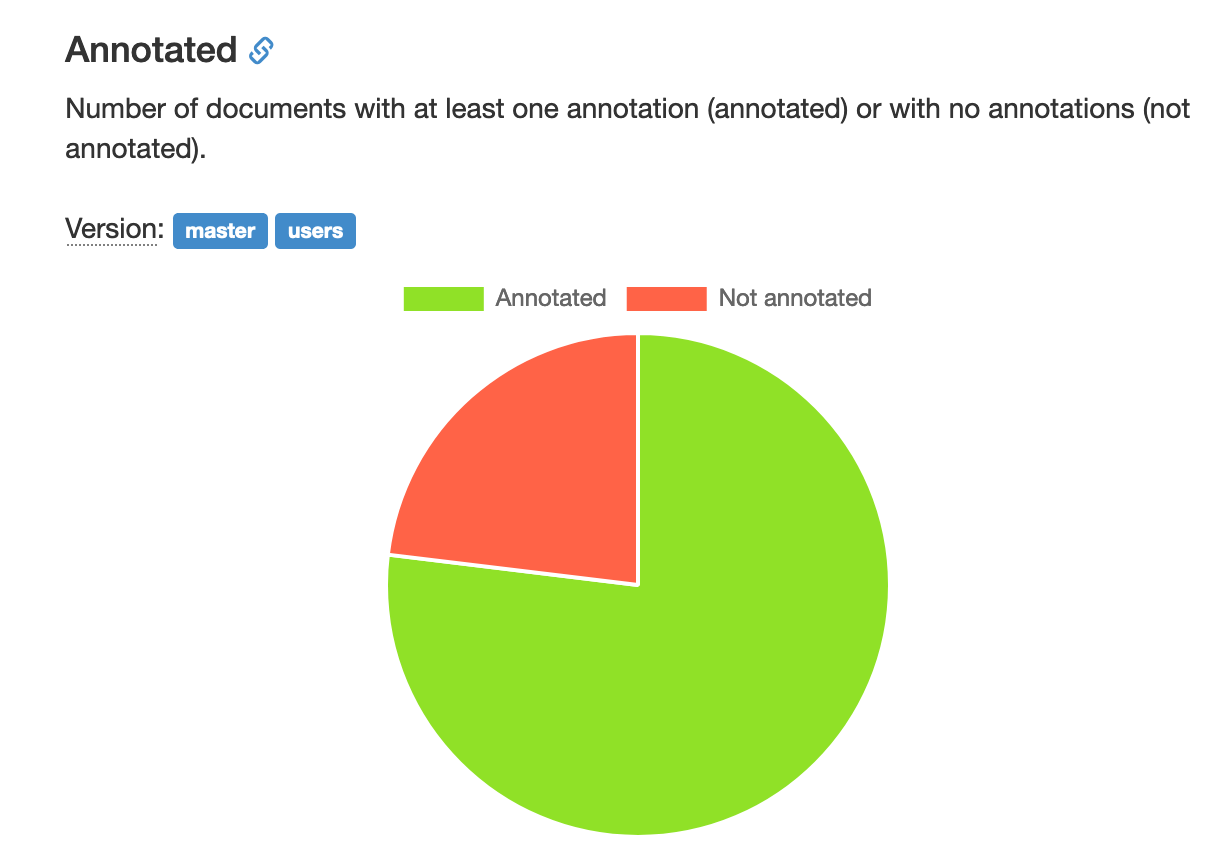
Example of Annotated VS Not Annotated documents. The master and the users' versions of the annotations have been used to calculate this metric.
Entities
The following charts are available:
Entity type distribution. Number of entities across all your documents, by entity type.
Entity type distribution across documents. Number of documents annotated with entities of specific entity type.
An entity type misrepresented or concentrated in a small sample of documents might lead to bias or incorrect predictions. Take action to improve the health of your data
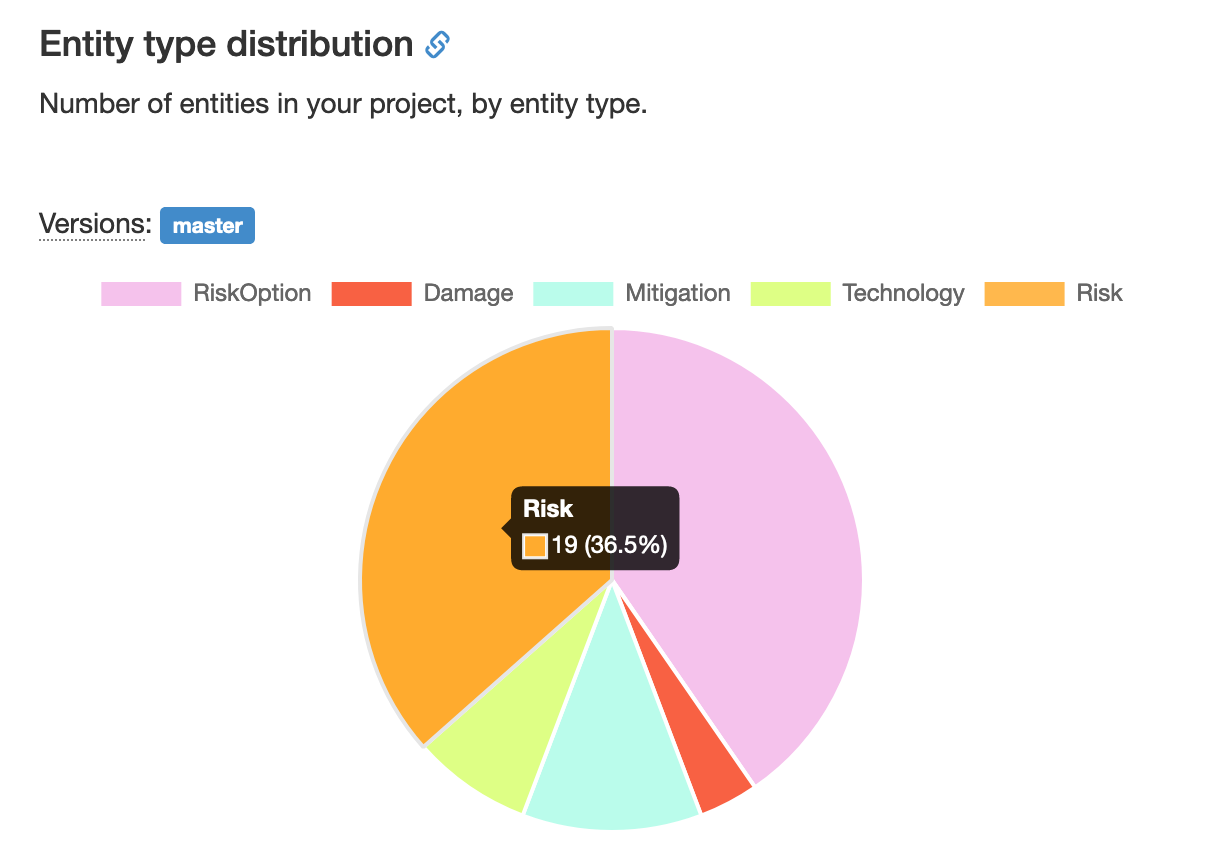
Example of Entity type distribution metric. Hold the mouse pointer to see the number of entities and percentage.
Normalizations
The following charts are available:
A chart per dictionary. It shows the number of documents annotated with specific normalizations (i.e. unique ids).
A normalization concentrated in a small sample of documents can lead to a misrepresented normalization and eventually to bias or incorrect predictions.
Document labels
The following charts are available:
Document labels distribution across documents. Number of documents with a specific document label set.
A chart per document label. For the `boolean` or `enum` types, this chart represents the distribution of possible values across the documents of your project. For the `string` type, due to its non-finite nature, this chart represents the top values across the documents of your project.
A misrepresentation of a document label or any of their possible values might impact the health of your data. Pay special attention to the representation of the values from your labels, it can lead to bias or incorrect predictions.
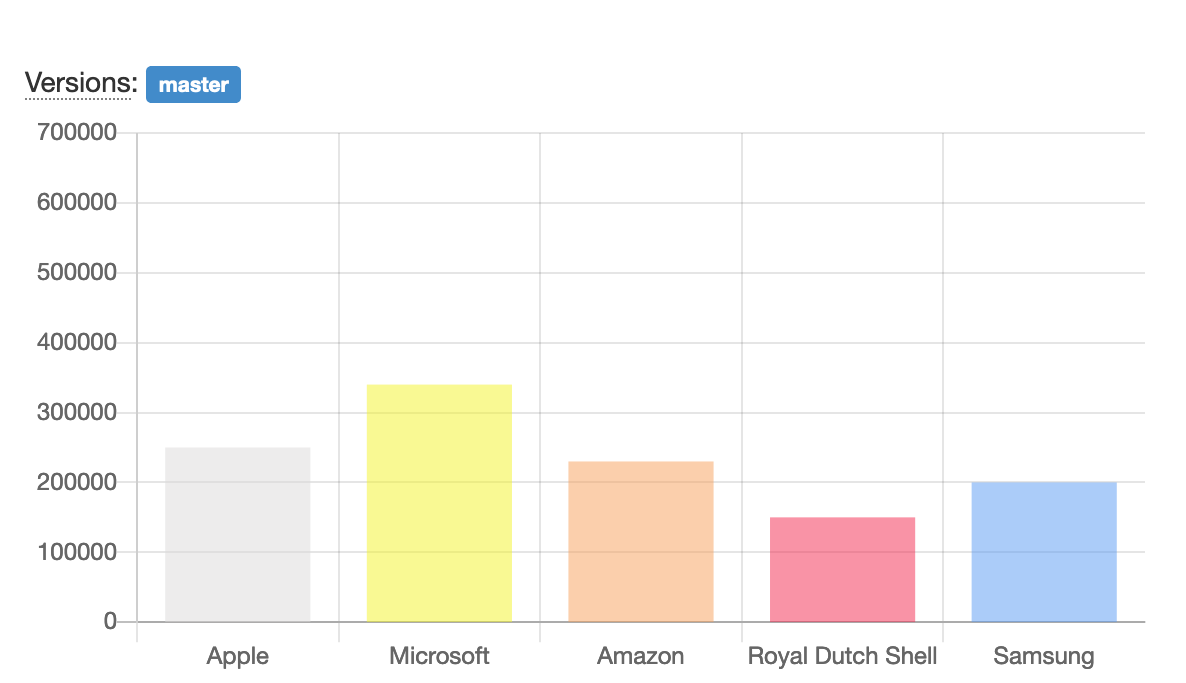
Example of document label metric. In this case, the type of the label is string and the top values are represented.